Lissajous Figures or Lissajous patterns is one of the applications of a CRO is to determine the phase, frequency, amplitude, and other characteristics of a given waveform. These characteristics can be determined in terms of known signal characteristics by the Lissajous patterns or Lissajous figures method.
Lissajous Figures or Lissajous patterns are named in honor of the French scientist who first obtained them geometrically and optically. They illustrate one of the earliest uses to which the CRO was put.
Lissajous patterns are formed when two sine waves are applied simultaneously to the vertical and horizontal deflecting plates of a CRO. The two sine waves may be obtained from two audio oscillators as shown in the figure below. Obviously, in this case, a sine wave sweeps a sine-wave input signal. The shape of the Lissajous pattern depends on the frequency and phase relationship of the two sine waves.

Table of Contents
Procedure to obtain Lissajous patterns
Lissajous patterns named after a scientist called Lissajous result when sine waves are applied simultaneously to both the horizontal and vertical deflection plates of the CRO. The waveform seen on the CRO screen will be the same as that given as the Y-input if the internal timebase circuit is used. If two different signals are given to the X and Y-plates, the pattern or figure seen on the screen is the resultant of the two inputs. From the shape or pattern of the resultant figure, the characteristics of the unknown input can be determined in terms of the characteristics of the known input waveform.
Two sine waves of the same frequency and amplitude may produce a straight line, an ellipse, or a circle depending on their phase difference as shown in the figure below.
In general, the shape of the Lissajous Figures depends on
(i) Amplitude
(ii) Phase difference
(iii) The ratio of the frequency of the two waves.
Consider the two signals applied to have the same amplitude and frequency with the phase difference of Ø between them,
e1 = Em sin θ
e1 = Em sin (θ + ϕ)
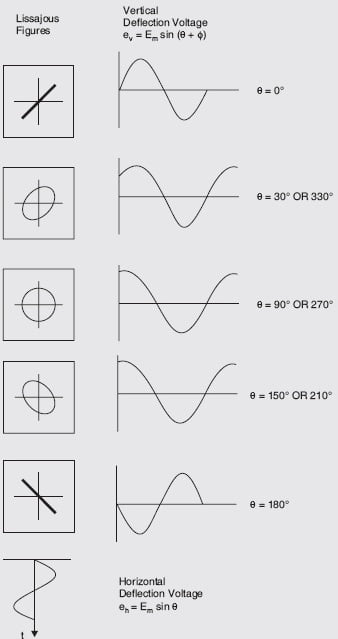
Straight Line
- The straight line is formed when the two voltages are in phase with each other or 180° out of phase with each other.
- The straight line formed angle 45° with horizontal when the magnitude of voltages are equal.
- An increase in vertical deflection voltage causes the line to have an angle greater than 45°with the horizontal.
- A grater horizontal voltage makes the angle less than 45 ° with the horizontal.
Circle
When the magnitudes of two voltages are equal and the phase difference between them is either 90° or 270°.
Ellipse
The ellipse is formed when the voltage is not equal and/or out of phase.
Uses of Lissajous Figures
Lissajous Figures is used as:
- Determining an unknown frequency by comparing it with a known frequency
- Checking audio oscillator with a known-frequency signal and find the frequency.
- Checking audio amplifiers and feedback networks for phase shift.
Frequency Determination with Lissajous Figures
The unknown signal is applied across one set of deflecting plates and a known signal across the other. By studying the resultant Lissajous pattern, unknown frequency can be found.
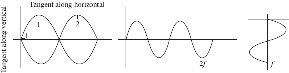
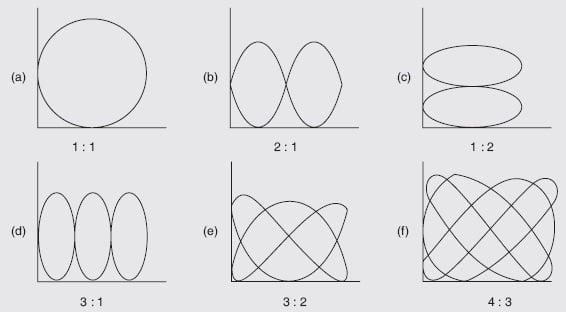
Depending on the frequency ratio, the various patterns obtained are shown in the figure below. The ratio of the two frequencies is given by
\frac{f_{V}}{f_{H}}=\frac{No. of points of horizontal tangency}{No. of points of vertical tangency}
In the figure (a), there is one point of tangency along the horizontal as well as the vertical axis. Hence, fH = fV i.e. the signals have the same frequency.
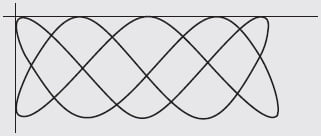
The ratio of frequencies when open-ended Lissajous patterns are obtained can also be found by treating the open ends as half tangencies as shown in Fig. 7.31.
\frac{f_{V}}{f_{H}}=\frac{No. of points of horizontal tangency+\frac{1}{2}}{No. of points of vertical tangency}
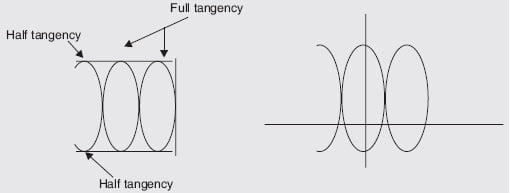
For the above figure we get,
\frac{f_{V}}{f_{H}}=\frac{2+\frac{1}{2}}{1}=\frac{5}{2}It should be noted that this method of frequency determination has limitations and is being discarded gradually because low-cost digital frequency counters are available in the market. The two main limitations of this method are as under:
(i) the numerator and denominator of the frequency ratio must be whole numbers,
(ii) the maximum ratio of frequencies that can be used is 10: 1. Beyond that, the Lissajous patterns become too complex to analyze.
Phase Determination with Lissajous Figures
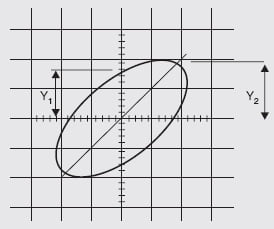
A Lissajous pattern is obtained on CRO with an unknown phase difference f. This pattern which is in the form of an ellipse, provides a simple means of finding phase difference between two voltages. The gains of the vertical amplifiers are adjusted so that the ellipse fits exactly into a square marked by the lines on the graticule.
Major axis lies in first and third quadrants
If the major axis of the ellipse lies on the first and third quadrants, its slope is positive as shown in figure below. Then the phase angle is either between 0° and 90° or between 270° and 360°. The sine of the phase angle between the voltages are given by
\sin \phi =\frac{Y_{1}}{Y_{2}}=\frac{X_{1}}{X_{2}};
\phi =\sin^{-1} \frac{Y_{1}}{Y_{2}}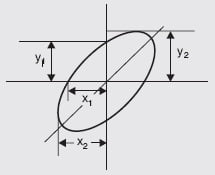
Major axis in lies in second and fourth quadrants
If the major axis of the ellipse lies on the second and fourth quadrants, its slope is negative as shown in Fig. 7.34. Then the phase angle is either between 90° and 180° or between 180° and 270°. The sine of the phase angle between the voltages is given by
\sin \phi =\frac{Y_{1}}{Y_{2}};
\phi =180^{o}-\sin^{-1} \frac{Y_{1}}{Y_{2}}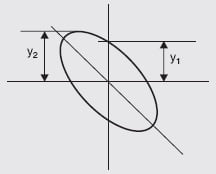
Example 1
The Lissajous pattern obtained on the CRO screen by applying a horizontal signal of frequency 1 kHz shown below. Determine the unknown frequency of the vertical signal.
Solution.
Given: fH = 1 kHz, number of vertical tangencies = 2 and number of horizontal tangencies = 5
We know that
\frac{f_{V}}{f_{H}}=\frac{No. of points of horizontal tangency}{No. of points of vertical tangency};
\frac{f_{V}}{f_{H}}=\frac{5}{2};
{f_{V}}=\frac{5}{2}\times 1 kHz=2.5 kHzExample 2
A Lissajous pattern on the oscilloscope is stationary having 8 vertical maximum values and 6 horizontal maximum values. Calculate the frequency of vertical input if the frequency of horizontal input is 1800 Hz.
Solution.
Given: fH = 1800 Hz, number of vertical tangencies = 8 and number of horizontal tangencies = 6
We know that,
\frac{f_{V}}{f_{H}}=\frac{No. of points of horizontal tangency}{No. of points of vertical tangency};
\frac{f_{V}}{1800}=\frac{8}{6};
{f_{V}}=\frac{8}{6}\times 1800 Hz=2400 HzExample 3
The Lissajous Figure obtained on the CRO is shown in the figure below. Find the phase difference between the two waves applied.
Solution.
From the Lissajous Figure shown in above figure, we know that
Y1 = 8 units
Y2 = 10 units
We know that if the major axis lies in the first and third quadrants then phase difference is given by,
\phi =\sin^{-1} \frac{Y_{1}}{Y_{2}};
\phi =\sin^{-1} \frac{8}{10}=53.13^{o}