Table of Contents
Signal Flow Graph (SFG)
The signal flow graph is used to represent the control system graphically and it was developed by S.J. Mason.
A signal flow graph is a diagram that represents a set of simultaneous linear algebraic equations. By taking the Laplace to transform, the time domain differential equation governing a control system can be transferred to a set of algebraic equations in s-domain. The signal flow graph of the system can be constructed using these equations.
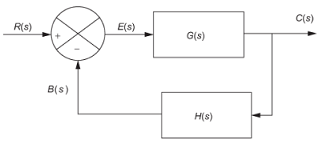
Block diagrams are very convenient in representing control systems. However, for complicated systems, the block diagram reduction approach for arriving at the transfer function relating the input and output variables is tedious and time-consuming. An alternative approach is that of the signal flow graph (SFG) developed by S. J. Mason. A signal flow graph does not require any reduction process because of the availability of a flow graph gain formula which relates the input and output system variables.
Definition: A signal flow graph is a graphical representation of the relationship between the variables of a set of linear algebraic equations. It consists of a network in which nodes representing each of the system variables are connected by directed branches.
The meaning of the following terms needs to be understood before proceeding further.
Node: It represents a system variable which is equal to the sum of all incoming signals at the node. Outgoing signals from the node do not affect the value of the node variable. The figure shown below shows a signal flow graph. Points designated by R, E, and C are the nodes of this SFG.
Branch: A signal travels along a branch from one node to another in the direction indicated by the branch arrow and, in the process, gets multiplied by the gain or the transmittance. For example, the signal reaching the node C from node E is given by GE, where G is the branch transmittance and the branch is directed from node E to node C.
Input Node or Source: It is a node with only outgoing branches; for example, R in the figure is an input node.
Output Node or Sink: It is a node with only incoming branches. However, this condition is not always met. An additional branch with unity gain may be introduced in order to meet the specified condition; for example, node C in the above figure has one outgoing branch. However, after introducing an additional branch with unit transmittance as shown in the figure below, the node becomes an output node.
Path: It is the traversal of connected branches in the direction of the branch arrows such that no node is traversed more than once.
Forward Path: It is a path from the input node to the output node when no node is encountered twice. R–E–C is a forward path.
Forward Path Gain: It is the product of branch gains in the forward path; for example, the forward-path gain of the path R–E–C in the figure is G.
Loop: It is a path that originates and terminates at the same node; for example, E–C–B–E is a loop.
Loop Gain: It is the product of the branch gains encountered in traversing the loop, for example, the loop gain of the loop E-C-B-E in the figure is –GH.
Non-touching Loops: Loops are said to be non-touching if they do not possess any common node.
Properties of SFG
The basic properties of signal flow graph are the following:
- The algebraic equations which are used to construct signal flow graph must be in the form of cause and effect relationship.
- The signal flow graph is applicable to linear systems only.
- A node adds the signals of all incoming branches and outgoing signals can be treated as an output node by adding an outgoing branch of unity transmittance.
- A mixed node that has both incoming and outgoing signals can be treated as an output node by adding an outgoing branch of unity transmittance.
- A branch indicates the functional dependence of one signal on the other.
- The signal travel along branches only in the marked direction and when it travels it gets multiplied by the gain or transmittance of the branch.
- The signal flow graph of the system is not unique. By rearranging the system equation different types of signal flow graphs can be drawn for a given system.
Signal Flow Graph Algebra:
A signal flow graph for a system can be reduced to obtain the transfer function on the system using the following rules. The guideline in developing the rules for signal flow graph algebra is that the signal at an anode is given by the sum of all incoming signals.
Rule 1: Incoming signal to a node through a branch is given by the product of a signal at the previous node and the gain of the branch.
Rule 2 : Cascaded branches can be combined to give a single branch whose transmittance is equal to the product of individual branch transmittance.
Rule 3: Parallel branches may be represented by a single branch whose transmittance is the sum of individual branch transmittance.
Rule 4: A mixed node can be eliminated by multiplying the transmittance of the outgoing branch (from the mixed node) to the transmittance of all incoming branches to the mixed node.
Rule 5: A loop may be eliminated by writing equations at the input and output node and rearranging the equations to find the ratio of output to input. This ratio gives the gain of the resultant branch.
Signal Flow Graph Reduction:
The signal flow graph of a system can be reduced either by using the rules of a signal flow graph algebra or by. using Mason’s gain formula. For signal flow graph reduction using the rules of a signal flow graph, write equations at every node and then rearrange these equations to get the ratio of output and input (transfer function).
The signal flow graph reduction by the above method will be time-consuming and tedious S.J. Mason has developed a simple procedure to determine the transfer function of the system represented as a signal flow graph. He has developed a formula called by his name Mason’s gain formula which can be directly used to find the transfer function of the system.
Mason’s Gain Formula:
The Mason’s gain formula is used to determine the transfer function of the system from the signal flow graph of the control system.
Let R(s) = Input to the system
C(s) = Output of the system
Now, Transfer function of the system, T(s) = C(s)/R(s)
Mason’s Gain formula states the overall gain of the system [transfer function] as follows,
Overall Gain, T=\frac{1}{\Delta }\sum_{k=1}^{n}P_{k}\Delta _{k}where Pk = path gain of the kth forward path.
Δ = determinant of the path
= 1 − (sum of loop gains of all individual loops) + (sum of gain products of all possible combinations of two non-touching loops) – (sum of gain products of all possible combinations of three non-touching loops) + ……..
Δk = the value of Δ for that part of the graph non-touching the kth forward path.
T = overall gain of the system.
Constructing Signal Flow Graph for Control Systems:
A control system can be represented diagrammatically by the signal flow graph. The differential equations governing the system are used to construct the SFG. The following procedure can be used to construct the signal flow graph of the control system.
- Take Laplace transform of the differential equations governing the system in order to convert them to algebraic equations in s-domain.
- The constants and variables of the s-domain equations are identified.
- From the working knowledge of the system, the variables are identified as input, output, and intermediate variables.
- For each variable anode is assigned in SFG and constants are assigned as the gain or transmittance of the branches connecting the nodes.
- For each equation, a SFG is drawn and then they are interconnected to give an overall SFG of the control system.
Procedure for converting block diagram to signal flow graph:
The signal flow graph and block diagram of a system provide the same information but there is no standard procedure for reducing the block diagram to find the transfer function of the system. Also, the block diagram reduction technique will be tedious and it is difficult to choose the rule to be applied for simplification.
Hence it will be easier if the block diagram is converted to an SFG and Mason’s gain formula is applied to find the transfer function. The following procedure can be used to convert a block diagram to an SFG.
- 1. Assume nodes at input, output, at every summing point, at every branch point and in between cascaded blocks.
- 2. Draw the nodes separately as small circles and number the circles in the order 1, 2, 3, 4, ….. etc.
- 3. From the block diagram find the gain between each node in the main forward path and connect all the corresponding circles by the straight line and mark the gain between the nodes.
- 4. Draw the feed-forward paths between various nodes and mark the gain of a feed-forward path along with sign.
- 5. Draw the feedback paths between various nodes and mark the gain of feedback paths along with signs.


